Continuous sell-in and sell-out data analysis for a more responsive supply chain
Heinrich Meyer and Michele Maina - August 7, 2024

In recent years, an increasing number of industry-leading companies have critically reviewed and analyzed the underlying assumptions of their supply chain planning process. They explored strategies to adapt to and thrive in today's volatile planning landscape. As a supply chain planning consultant, I see greater interest in businesses collecting and analyzing sell-in and sell-out data.
Sell-in refers to volumes sold by manufacturers to wholesalers, distributors, and other large B2B customers over a given period of time. In contrast, sell-out refers to volumes sold by these B2B customers to retailers, grocery stores, local stocks, and consumers.

Why is sell-out data so important? If the goal is to better understand the market potential of a product portfolio, meaning its total unconstrained demand, sell-out data is the true signal. Having access to that data has many benefits: it helps detect shifts in competitive activity, sense changes in consumer behavior with minimal latency and ultimately helps build a picture of all demand drivers for products.
Sell-in forecasting can suffer from major bullwhip effects
The difference between the two is very relevant from a supply chain planning perspective, in particular in relation to the forecasting process. At present, most manufacturers try to predict demand based on historical sell-in data, because this information is available through their own sales and distribution processes.
But this data is far from perfect, especially where demand is volatile, as is more and more the case right now. If consumption behavior changes, for whatever reason, it takes some time before the effect is reflected in the sell-in data. This latency means the supply chain’s response is delayed.
Where does this latency come from? It takes some time for actual demand changes to be translated into lower inventory in the distribution channel, then into a replenishment order inside the distribution channel, then to a sales order coming to the supply chain itself. This means the time from sell-out to sell-in signal can get very long (a number of months). As a result, consumer behavior can shift and manufacturers only get distorted signals months later. And given the trend for increased SKU proliferation, which usually means lower order volumes, less frequent orders and smaller production runs, the impact of latency only increases.
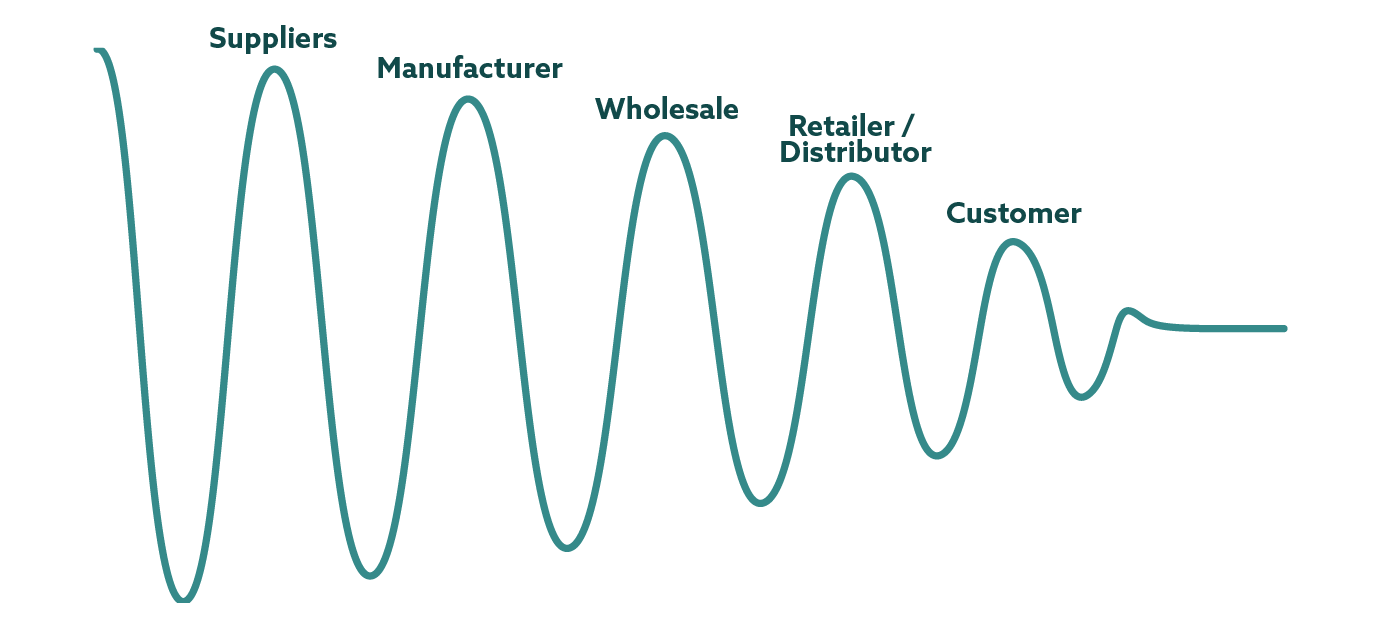
The more sales and distribution stages there are beyond the manufacturer’s control, the greater the bullwhip effect can become. The bullwhip effect is the amplification and distortion of demand signals as they travel upstream.

For instance, the bullwhip effect can occur when sell-out does not follow the retailer's forecast. If retailers stop their sell-in orders to hedge against overstocking a non-selling product, this can send a false signal up the supply chain. Manufacturers may interpret this as a drop in demand and halt production. However, when the replenishment signal eventually picks up, manufacturers may face lead time issues, resulting in supply shortages.
Conversely, if sell-in overshoots due to a promotion or the temporary unavailability of a competing product, it might suggest a higher forecast than will be realized. This can lead to stock buildup in the channel, requiring companies to spend trade funds to buy back leftover inventory, create waste, or sell off excess inventory in a B-channel at a lower margin.
Therefore, traditional risk mitigation approaches, such as stockpiling, do not offer a simple solution for addressing these complexities; companies must control inventory and production costs in a challenging economic environment while still maintaining service levels.
Getting hold of accurate sell-out data
That’s why supply chain leaders now want to leverage the potential of analyzing the differences between sell-in volumes and sell-out volumes, resulting in a reduced signal latency, but this comes with a number of challenges.
Consider the following steps when adopting an outside-in strategy incorporating sell-out data.
1. Clarify business value of data
Start with clearly defining the business need for data and its potential value. Rather than processing data aimlessly, it’s more effective to gather data based on specific business needs to prove value and gain stakeholder buy-in. In most cases, this means talking to other teams inside your organization. For instance, marketing could leverage insight around campaign effectiveness and inform changes in strategy, while Sales may reach out to retailers that have big mismatches between sell-in / sell-out to understand root causes … Understanding how the organization can respond in an optimal, coordinated fashion rather than as separate silos is key to process improvement. What we have seen is that starting with small-scope projects targeting the most significant pain points and iterating regularly, delivers the most successful results and proves value to the wider organization.
2. Acquire accurate sell-out data
Second, the company needs to get hold of sell-out data. Here, companies should identify internal and external sources to fill data gaps, recognizing that internal data may be underutilized due to barriers and lack of interdepartmental communication. This highlights the need for stronger collaboration within the organization and with external partners. There are multiple channels for external data sources, depending on the sector and the size of the market. The consumer goods industry in the United States, for example, is very much dominated by just a few wholesalers, which means that it’s worthwile for companies to make agreements with these wholesalers to get regular sell-out data updates. In the life sciences industry, market intelligence companies such as IQVIA provide point-of-sale data aggregated at local, regional, national, and international level.
3. Analyze and refine data
Finally, process the data to distinguish valuable signals from noise, leveraging AI tools to streamline this effort. Even incomplete or noisy data can yield insights, as AI models help eliminate noise and enhance data quality governance.
Blog post
In a recent case study, OMP collaborated with Nestlé, as part of the Spark Initiative, to further explore the benefits underlying increased demand visibility by adopting an outside-in approach to planning. The test case addressed the difficulties in accurately forecasting new product launches by incorporating Walmart sell-out data for demand planning. The results revealed that using POS data could substantially decrease demand latency by up to 15 weeks, enhance forecast accuracy by 15% and reduce inventory by 10%. Thereby further highlighting the advantages of greater visibility and collaboration across the supply chain.
While embarking on this journey with our customers, we've realized that unlearning outdated practices is just as crucial as adopting new ones. It's essential to progress step by step, allowing time to thoroughly understand the new concepts and support those insights with concrete, fact-based proof of value.

Blog post
Multiple models to fit different situations
Getting downstream data is one thing, getting insights is another. Many factors need to be taken into account. For example:
- Are the sell-out data sufficiently accurate, complete, and detailed?
- Do we have insight into the wholesaler’s inventory policies and replenishment lead times?
- Could the differences between sell-in and sell-out be due to secondary phenomena such as cross-regional or parallel trade?
While there’s no silver bullet to achieve this, OMP has developed multiple models and strategies to fit different situations. A preliminary analysis by the OMP Advisory team can give a good indication of which strategy would work best to make a supply chain more responsive. This analysis can also assess the value that continuous sell-out to sell-in conversion would bring to the company.
If your company already has a mature strategy for collecting and processing SISO data, schedule a short demo with one of our expert consultants to see how OMP’s Demand Planning solution can be leveraged to provide accurate, low-latency demand signals for your supply chain planning.

Heinrich Meyer
Presales Consultant at OMP BE
Biography
Heinrich's experience in both project and presales discussions allowed him to build an extensive spectrum of business understanding and technical knowledge. With the goal of maximizing value for OMP's customers and prospect, he bridges the gap between business, operations and technical/functional possibilities.

Michele Maina
Senior Product Expert at OMP BE
Biography
With 15 years of supply chain planning experience, Michele has built extensive expertise in Demand Planning and Sales & Operations Planning processes, modelling aspects and planning solutions, mostly focusing on the consumer goods, food & beverages, pharmaceutical and chemicals industries.


